Measuring end user experience and tracking impact following environmental change, whether it be planned or unplanned, can be a serious challenge for many organizations. I’ve seen a mixed bag of methods, including poorly configured (and typically neglected) server monitoring products, service desk reporting based on logged tickets and the evaluation of staff feedback surveys. Let me be clear, staff feedback on their user experience is invaluable in its own right, but it’s subjective where one user’s ‘lighting quick’ is another user’s ‘I’m over this, man!’
IT teams and technical leaders are frequently asked challenging questions such as;
- “How is our user experience and what are the key impacts affecting it?”
- “What is needed to improve the user experience?”
- “What was the root cause? Infrastructure or application configuration?”
As a service provider, we identified the ever-growing demand to not only answer these questions quickly and accurately but to proactively improve and deliver real-time insights and analytics to mitigate how often questions need to be asked. All too often, IT departments rely on ‘best efforts’ and guesswork through lack of visibility which typically results in lost time, wasted resources and frustration. Our team has the first-hand experience with these challenges and that was the catalyst for us to craft a service that solves these problems for our partners and clients alike.
There are many benefits of having deep insights and effective reporting capabilities so let’s run through a few…
Increased Productivity
Inefficient environments mean longer load times, bigger chunks of your budget and more time and effort. Understand and identify where issues are whilst minimizing failure, which in turn can increase user productivity and your bottom line.
Justification of IT Spend
Understanding the true value of system changes and ‘Proof of Concepts’ using comparative analytics provide data backed justification of IT spend which lead to well developed IT budget and strategy initiatives.
Cost Savings
Remediating issues before they have an impact on user experience and before they cause outages, and, therefore, maintaining the highest level of user productivity. Efficiently size and allocate ‘machine resources’ to avoid unnecessary overspend. While this is important in traditional on-premises infrastructure, it becomes critical in private, hybrid or public cloud environments.
Staff happiness
Predict and prevent! Staff happiness can be tricky to measure but there are key metrics such as staff turnover; if this is high then it’s safe to say staff generally aren’t happy. It’s easy for technical people who have some form of control over their user experience to forget how painful poor experience can be. It’s not uncommon in a worst-case scenario for users to give up and move on as “IT just can’t get it right!” In the best case, these users simply aren’t as productive as they could be and that has a direct impact on the bottom line.
Specific Actions
Monitoring tools, providing they are maintained and configured correctly are great at telling you when something is wrong but typically don’t tell you what to do to fully remediate existing or impending issues. Recommendations backed by specific actions provide a way forward for improving the overall experience.
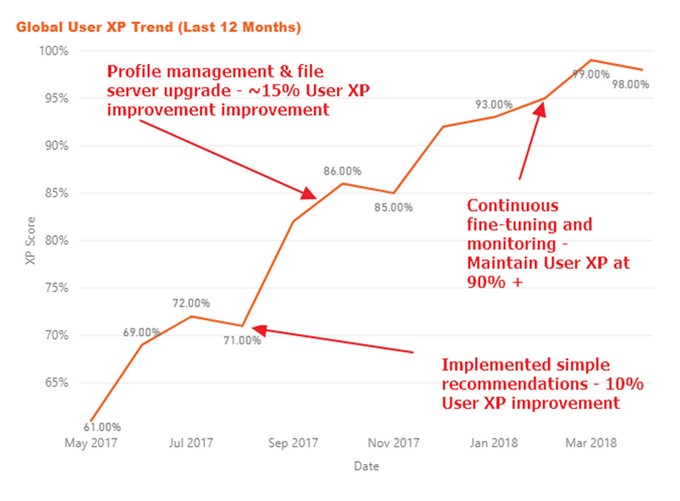
We accurately measure user experience across the entire supporting infrastructure which can be filtered globally, by region or by site, all the way down to the individual. This is achieved by collecting many metrics such as login times, application performance, endpoint resource usage, failure and fault rates, network analytics such as bandwidth, latency and protocol statistics and others. This data is processed and delivered via customizable dashboards which provide meaningful insights enabling data-driven decisions. The following example shows how the user experience was improved for a global operation over the course of 12 months by leveraging our Predictive Insights and Analytics service (PIA)
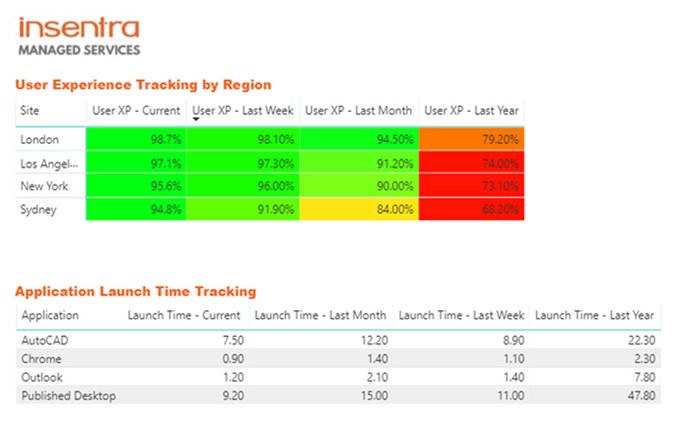
We also deploy virtual users across the environment which can be thought of as mystery shoppers. They will log in and run applications simulating load behaving just like a user would. These are configured to run 24/7 ensuring that desktops and applications are always available and performing within configured SLA’s. This provides real-time and predictive analytics and reporting to complement short and long term historic reporting. The following example shows current and historic insights for key areas of focus across various applications and regions.
If you have virtual users then you gotta have virtual engineers, right!? Let’s say we define a specific application to have a launch SLA of 2 seconds, having the understanding that anything over that will impact the user experience. This is closely monitored and should it go into an amber status, such as an average of 1.8 seconds, we can have our virtual engineer carry out a number of tasks from something simple like generating an alert and notifying the support team through to proactively scaling up instances to deal with the demand or removing problematic servers from the farm which are underperforming.
I’ve focused mainly on the importance of user experience throughout this article but I’ve only scratched the surface. If you would like to know more about our PIA service get in touch so we can schedule a demo and better understand how we can help. We have many service levels that can be further customized to your needs.


