As part of the Insentra User Experience as a Service (UXAAS) offering we are constantly chasing how to deliver a superior experience to the end-users of our partners and their clients. A major asset in this regard continues to be our dashboard. While data collection is key, dashboards help provide clarity and a visual representation of data – giving an idea of what is going on at a glance. They empower administrators and all management levels to identify potential issues – or confirm things are running well! There is nothing better than working with a client to implement improvements and being able to quantitatively see the user experience get better as a result. However, the humble dashboard has some secrets, which can end up hurting more than helping.
One item we as an industry like to watch and show our clients as a good metric of performance is average application launch times.
Here is an example of a dashboard built for one of our clients showing their 7 most highly used apps in a Virtualized XenApp environment:
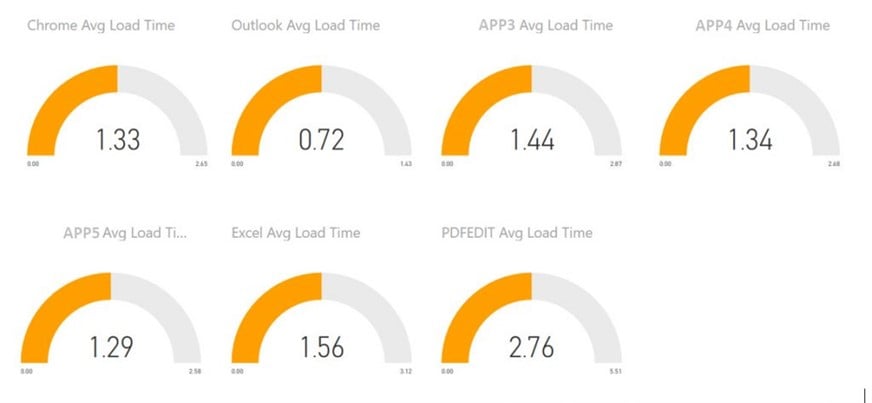
Everything looks good here, right? Chrome is launching at a very reasonable 1.3 seconds on average and PDF Publishing application (PDF Edit our slowest launching application) in under 3 seconds. In fact, all the major applications launch in under 3 seconds which is very good. We were initially quite pleased with these results, taking them to mean all was well.
However, averages only show a part of the story as you’ll soon see and can be a dangerous thing in a highly utilized and dynamic environment.
Why Averages can fool you
Let’s take a closer look at a very familiar and highly used application in any environment – Chrome. The overall average launch time for the application is below:
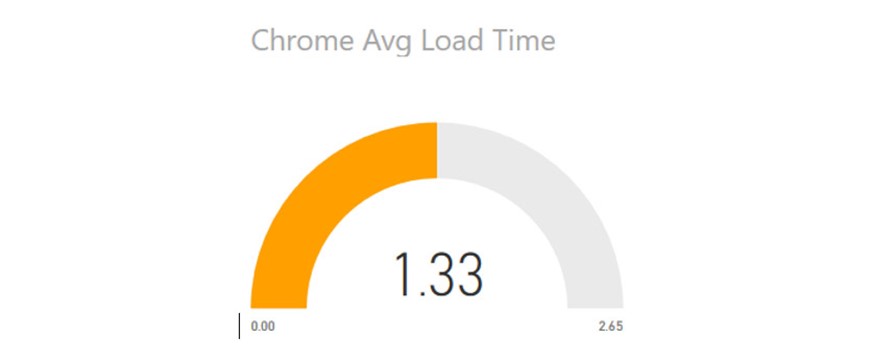
The gauge shows an average launch time of 1.33 seconds, which is an excellent result. But how do we determine if there is a difference between lightly and heavily loaded times? What about weekends? To answer this question, we built some additional gauges for this client. So, let’s look at the actual application launch times rather than just their averages:
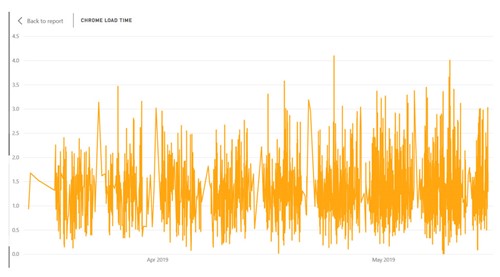
Whoa! Suddenly1.33 seconds average launch time isn’t looking very relevant, is it? We can see a clear pattern of very quick launches – weekends and holidays, but then a large spread of launch times for Chrome during production. Our relevant launch time is more like 3 seconds – with some absolute outliers in the 4 second range. Now, 4 seconds is still not bad, but suddenly we have some additional data we can work with!
OK, while Chrome still seems very realistic, let’s look at the slowest launching application in this client’s environment. PDF Publishing application “PDF Edit” also looks like it has a very reasonable launch time for a highly used application:
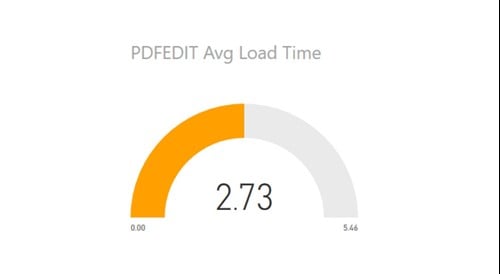
However, we know this application is heavy, and we know we have users complaining it’s slow. So what happens if we dive a little deeper and graph the number over time? The story changes dramatically:
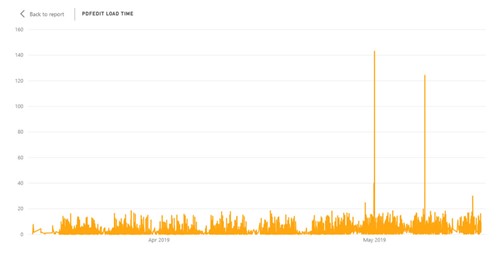
Wow! Once again, what looked to be a very reasonable average launch time (2.73 seconds) turns into a very different picture. The relevant application launch time during production hours is more like 10 – 15 seconds with some launch times being dramatically higher, in the 18-20 second range – never mind the two huge spikes we see in May. Now we can see and understand why users think this application is slow to start, and work to resolve it.
With this data in mind, we’ve decided to tweak our application launch dashboard with something giving us both the average and the actual data.


